Waste.FM – Scrobbling Deleted Files

20140125-162936.jpg

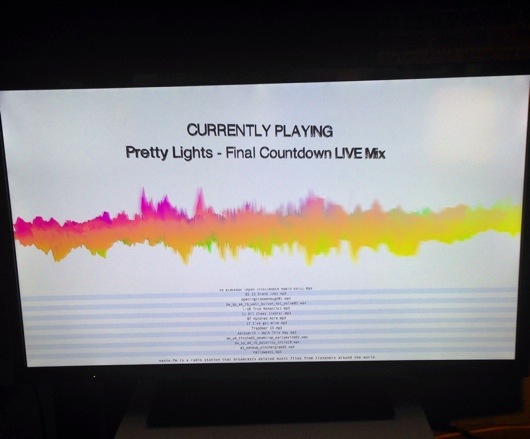
Saw this today at Eyebeam. Play certainly with last.fm idea, scrobbling the files you delete rather than the music you’re playing.

Waste.fm is a radio station that broadcasts discarded audio files from around the world. Users take the place of DJs, contributing to the radio station whenever they delete files on their computers using the Waste.fm desktop application. Waste.fm uploads these files to the radio station and broadcasts them both on the project website and desktop application. The radio broadcast plays every deleted audio file once, and then permanently deletes it from the archive.

Numerous social music services use collective data to recommend and serve us songs based on our listening histories and online friends, leaving us at the mercy of what algorithms such cloud-based services use to determine our artistic tastes. Whether these algorithms are diagnostic or prognostic, they have changed how many of us experience music today. What happens to the musicians who are outliers of established genres? Are there more serendipitous ways for us to find music that skirts the periphery of our predicted repertoires?

Posted in art and erasure | Comments Off on Waste.FM – Scrobbling Deleted Files

No Such Pipe

http://instagram.com/p/iqyIU7HxEG/

Happy New Year!

Posted in art and erasure | Comments Off on No Such Pipe

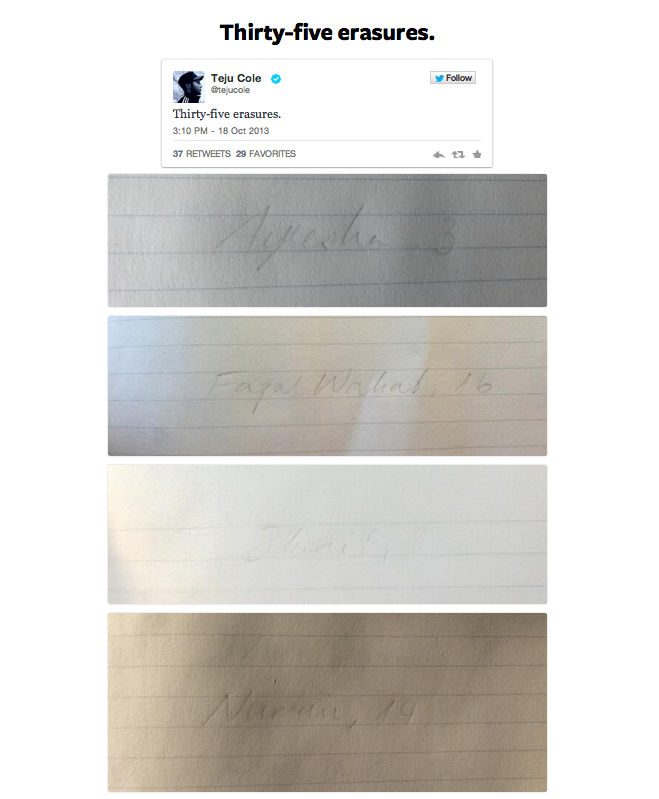
35 erasures

35 erasures

A compelling juxtaposition of slippery tweets against images of erasures performed on lined paper. The shifting white-balance threads the corporate blue and “verified account” tick into a drone dead drama. The persistence of these media still greater than some of the world’s children. [see: Thirty-Five Erasures]

Posted in art and erasure | Comments Off on 35 erasures

read/re-write city – the production of space in graffiti removal

Read/ReWrite City is a time-based visualization of the locations where New York City performed graffiti identification and removal.

Continue reading

Posted in graffiti removal | Comments Off on read/re-write city – the production of space in graffiti removal

walking the data set: spatial reading of graffiti removal

I took the City’s graffiti locations data set for a walk last Sunday in Brooklyn using the graffiti web app.

As discussed in my last post, mapping and animating the graffiti locations reveals patterns of paths and intensities. These are the locations of the graffiti that the City found and removed. The paths and intensities reveal a sequence – a potential order by which the two activities of graffiti identification and removal progressed. We can go back and trace that sequence, performing a comparative reading of the database record with the street.
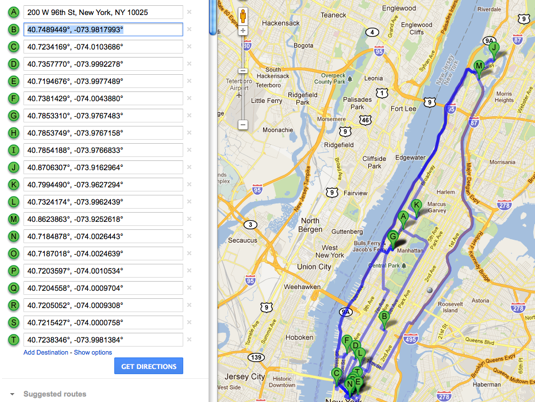
Brooklyn Graffiti Removal Tour - The Writing Path

Brooklyn Graffiti Removal Tour - The Writing Path

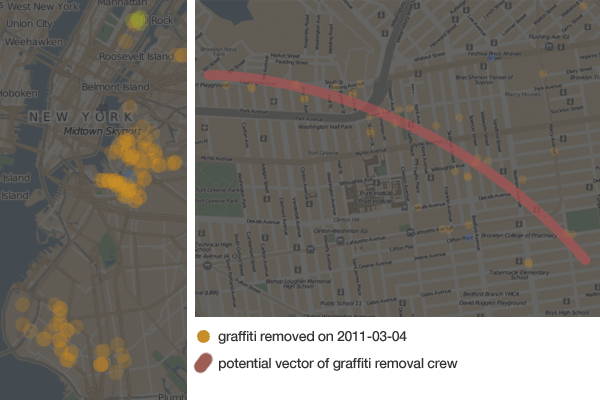
Planning: I queried the database for those days in which the highest number of graffiti removals were recorded. The most active day for graffiti removal according to the data set for Brooklyn was March 4th, 2011. As we can see from the zoomed-out map above, there appears to have been a few crews at work that day. I zoomed in on the map and selected a portion of the locations that would be the easiest to walk. While there were quite a few good routes to choose from, I settled on one that would keep me nearest to Fort Greene (for a reason).

With my plan in hand, I set out on my journey to trace and annotate spatial data back to the street.
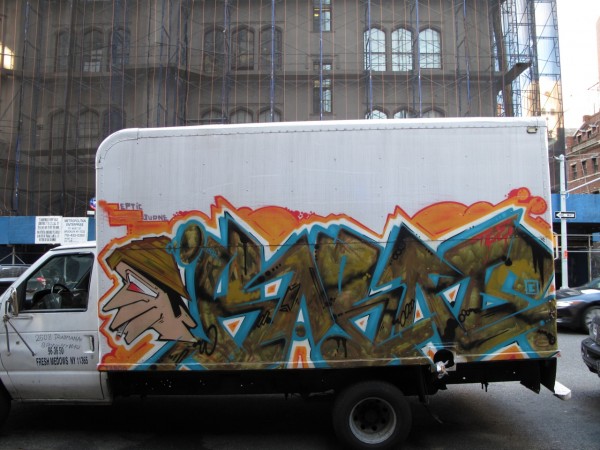
First thing I noticed was how mobile graffiti can be. This truck was parked across the street from a bank in the Upper East Side. The side of this truck is not a location one will find in the City’s list of graffiti locations. Shortly after, I came across a creek of bleach white water flowing out of a building and over the road. Seeking out a path of least resistance, it formed a figure upon the street.
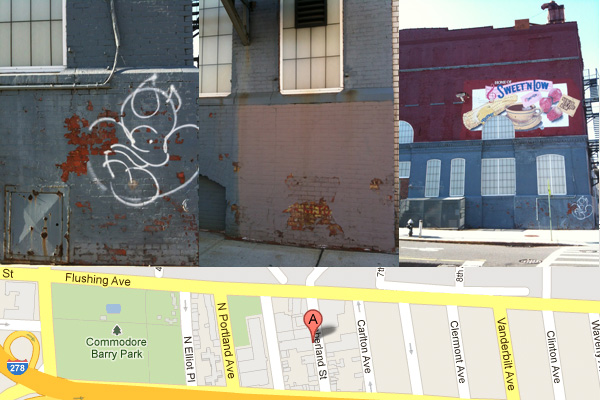
2 Cumberland St

Along Flushing Avenue: My first stop was 2 Cumberland St. A Sweet ‘n Low factory. A large weathered sign proclaims it to the street. Below the security camera a recent tag. “March  4th 2011 – Cleaning crew dispatched. Property cleaned” states the record in the data set. Fresh paint is nowhere evident. Only a perfectly square paint job on the North side of the building suggests the location of a graffiti removal performed some time ago.
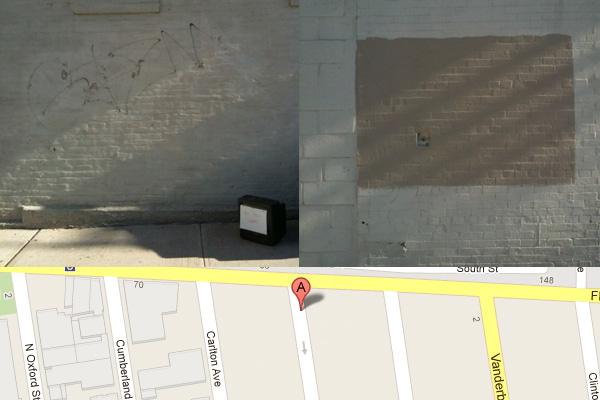
Adelphi St

My next stop was Adelphi St. The data set reports graffiti removed here a couple of times within the past year. 7 Adelphi St had graffiti removed in March and in November. The same statement made on both occasions: “Cleaning crew dispatched. Property Cleaned.” Quite intriguingly, it appears that someone has physically tried to wash a tag off the wall. The paint buckled and peeled under the pressure. Evidently the plan didn’t quite work as intended and now it gives the curious impression that someone tried to excavate this tag buried under a layer of white paint.

The security gate of the light industrial building across the street is covered in graffiti. It probably was open when SCOUT came by.
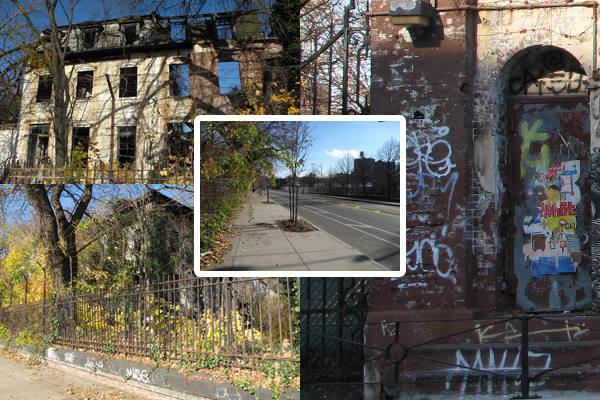
Flushing St in Brooklyn

Moving down the street, I noticed how fresh Flushing St looks. Wide and smooth sidewalks, smooth paving, new trees. The South side of the street is made up of a  combination of light industrial and mixed use buildings. The North side has a couple of large factories and quite few abandoned buildings. Trees and shrubs spill out from these burnt out buildings, covering up graffiti scrawled on the curb. Nature has a program of graffiti removal too.

176 Flushing Ave: A large warehouse. Layers of grey paint, in a variety of shades, mostly square. “March 4th – Cleaning crew dispatched. property cleaned.” 248 Flushing Ave: Starting to think the March 4th crew like performing neat square paint jobs. Just a brick-red square on the maroon wall. “March 4th – Cleaning crew dispatched. property cleaned.”

Brooklyn-Queens Expressway

The trace takes me down to Park Ave. I cross under the Brooklyn-Queens Expressway. There is a large mural under the elevated freeway. It evokes a sense of the crossing: an ocean or perhaps two mountainous and colorful lands separated by water. The concrete divides the image. The light divides it further. A shopping cart and a few pieces of wood lie on the cobble stones.
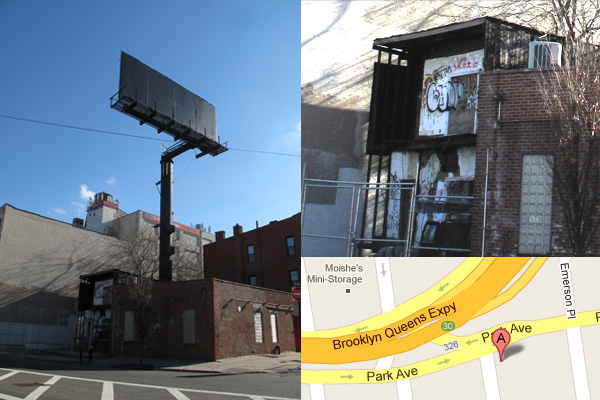
Park at BQE

Toward Bedford: Towering over 342 Park Ave is a billboard with nothing on it. A large canvas communicating nothing to the drivers flying (or crawling) by on the BQE. 342 Park is the first brick building I’ve seen on my tour that has not been painted. The bricks are fully exposed. Along the North wall appears to be the trace of graffiti removed through some chemical process. It later occurs to me, after walking by, that the removed graffiti could be facing the immediate neighbor – a burnt out building that appears to have been severed in half. This building is not on the list of locations to be cleaned, yet the walls on either side of it have been treated.

Fran Tonkiss writes, “The moment at which graffiti stops being graffiti … is suggestive of how the city gets signified.” Tonkiss is referring to graffiti that becomes art and placed in galleries. Here, however, the graffiti seems to have been removed from the street – no longer identified as graffiti by city officials. What does it mean when graffiti is no longer read as graffiti on a dilapidated building?

148 Classon Ave: “March 4th – Cleaning crew dispatched. Property cleaned.” It is a light industrial building. There is graffiti on a door and a garage door. The scale of the graffiti on the garage door is larger than the ones on the door, but it compensates by the greater quantity of tags. Even a short metal fence seems to reduce the chance of a wall getting tagged. 81 Steuben: layers of paint creating the impression of a high-water mark sign or the mural under the BQE.
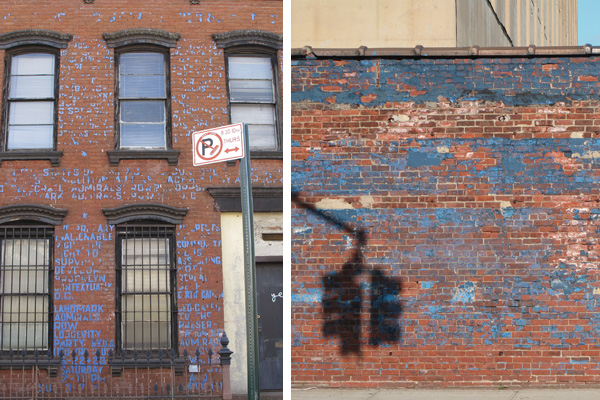
BOMB on Steuben

Walking down Steuben St, I fortuitously came across a building covered in blue-tape. An entire essay appears to have been written across 102 Steuben St. A sign over the door (also in blue-tape) spells out B.O.M.B. – Brooklyn’s Other Museum of Brooklyn. My immediate impression was of how similar the peeling blue letters looked to the peeling blue paint of a rather long stretch of wall back on Flushing Ave. This combination of blue and red brick seems to be a staple colour palette in the area – thinking back to the Sweet ‘n Low building too.

Yet, 102 Steuben St turns out to be tactical use of materials. The rather traceable author of this message, Scott Witter, covered his home with a political protest letter addressed to the mayor concerning the controversial Atlantic Yards project. Why blue-tape? The author told the Brooklyn Paper: “I [once] went out [with] a can of green paint and started painting. I got arrested right on Flushing Avenue. I spent 22 hours in jail. [And I learned that] tape is not considered graffiti because it’s temporary.”

Across the street from 102 Steuben is 89 Steuben St – a large warehouse. I exchange a greeting with a man unloading pineapples from a truck. Graffiti was removed from this building on March 4th. The record reads: “Cleaning crew dispatched. Property cleaned.”

Down Bedford:
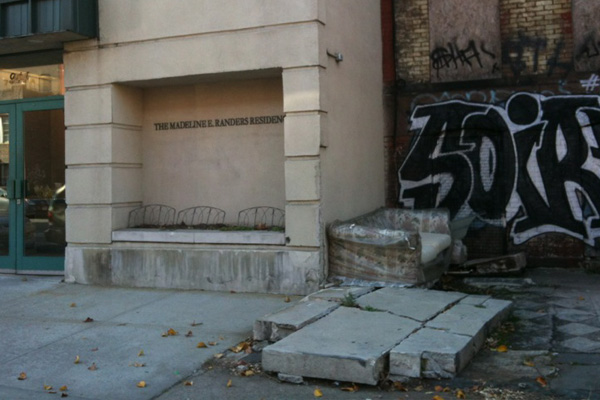
944 Bedford

944 Bedford Ave: “March 4th – Cleaning crew dispatched. Property cleaned.” This is a photo taken outside between 944 Bedford (the building on the left) and its immediate neighbor (940 Bedford). Again, it appears that the property line becomes an important frontier of signification. Graffiti was identified on 944 and graffiti removed on the wall behind the couch. Yet, imagine moving the couch to paint the wall or walking past this and jotting down for removal the graffiti behind the concrete slab and couch.

9__ Bedford Ave: “March 4th – Cleaning crew dispatched. Property cleaned.” I’m obscuring the address, but the property of this inhabited single family home challenges the definition of “clean”. It is here that I realized that the phrase “property cleaned” actually serves to obscure the very thing that was removed. It isn’t about picking up the garbage,  washing windows, mending a broken awning, or arranging the scattered objects left in front of the house. “Property cleaned” refers to graffiti, but refuses to identify it as such.
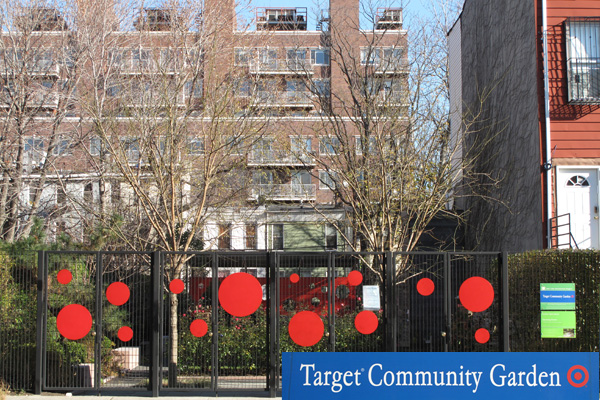
Target Community Park

Across the street from the home on Bedford Ave is a pocket park with large red dots on the fence. These dots align with a red wall in the back of the park. Reading these dots together across an inaccessible park made me feel like I must be the subject of a corporate sponsored “community outreach project.”

“The more unlikely or risky the site,” writes Fran Tonkiss, “the greater the claims of the artist as a tactician of space.” Again, although Tonkiss is referring specifically to the graffiti maker as the artist, here the artist could be the actors involved in making this park and affixing those red dots. The “risky site” is a “rapidly revitalizing” neighborhood. By making a calculated contribution to this neighborhood, Target can promote its brand as an agent of change or social responsibility. Yet, to make this claim it has to suspend its sign across a highly controlled space.

I concluded my reading of the written space at 305 Franklin Ave. What a perfect place to take a break! 305 Franklin Ave is the address of an artisan doughnut bakery. While I didn’t exactly look too hard for traces of graffiti removal, I cannot help but wonder if the removal crew stopped in here for a tasty blood orange doughnut or perhaps the Passionfruit with Cocoa Nibs doughnut! Yes, polishing one of these off would certainly be worth a log entry. “March 4th – Cleaning crew dispatched. Property cleaned”.

“The practice of writing depends on a good reading of space: finding a site, making a reconnoiter of the scene, establishing points of access and getaway, choosing the moment.” Fran Tonkiss is referring here to the practice of writing graffiti on to the city, but perhaps this practice can also be seen in the work of the City’s graffiti removal. Why remove graffiti on one location, but not another? SCOUT is a synonym for reconnoiter – a strategic observation of the street. Are the paths through areas solely a traveling salesman problem? Is there a sense of the appropriate moment for reading and writing the city?

Certainly we may not be able to ascertain the city in the exact same sense as the consciousness that perceived it, but the act of walking the city by these records animates them with life and imagination. They become articulated and interpreted to the street and within the context of their authoring. It is a reading out loud.

Does it produce any meaning? I think so, but it is a cheeky meaning. Employing Roland Barthes’ definition of Eros in the reading of the city, Tonkiss says, “the city is intrinsically erotic as a space of exchange, of vitality and connection.” I would replace erotic with comic.

The city reads like a comedy where the cast of characters all seem to play their part with sincerity. A bureaucratic stamp pronounces victory upon properties adjacent to disaster. Graffiti returns as quick as it disappears. Paint on walls are not the only way to tag a building. This isn’t to say that it is a tragedy. Something does seem to be working here. With little more than exchanging a few words with people in the street, in walking the data set I experienced the street as a site of richly textual discourse. The vector of graffiti removal is one important arc in the spatial argument.

Posted in graffiti removal | Comments Off on walking the data set: spatial reading of graffiti removal

visualizations of graffiti location data set

The video animates the reading and writing processes that government agencies and contractors perform. Each dot in the animation represents a record within the graffiti locations data set that the City posts on NYC Open Data. The placement of each dot in the video is based on GPS coordinates mapped to screen coordinates. The duration represented by each animation is about 12 months, starting September 13, 2010 and ending August 18, 2011.

Continue reading

Posted in urban media forensic archaeology | Tagged , | Comments Off on visualizations of graffiti location data set

the simmering pot: from data source to data sauce

In my last post, I tried to situate my exploration of a data set within media archaeology by foregrounding the gaps contained within the data set and how those point back to the discursive context of urban space. It was for this reason, that I am exporting the data set from NYC Open Data and loading it into a new database – to simulate a restoration of what is removed or omitted. The following is a more specific and technical description of my process that includes the problems encountered, patterns discovered, and the decisions made.

Extracting the data is the first step of data storage process known as the extract, transform, and load (ETL). I am adopting this term, because moving and transforming a source data set is always substantial and therefore ought to be documented. Certainly even the contents of NYC Open Data is the product of data extracted from operational systems, transformed to meet certain operational goals in presenting the data on a website, and finally loaded on to the Open Data platform.

The source data set contains the following attributes and formats:

  • Incident Address Display (Text, e.g. “1 AUDUBON AVENUE”)
  • Borough (Text, e.g. “MANHATTAN”)
  • Community Board (Text, e.g. “12 MANHATTAN”)
  • Police Precinct (Text, e.g. “Precinct 33”)
  • City Council District (Number, e.g. “10”)
  • Created Date (Date Format, i.e. “MM/DD/YYYY HH:MM:SS AM -0500/-0400”)
  • Status (Text, i.e. “Open” or “Closed”)
  • Resolution Action (Text, “Cleaning crew dispatched. Property cleaned.”)
  • Closed Date (Date Format, i.e. “MM/DD/YYYY HH:MM:SS AM -0500/-0400”)
  • X Coordinate (Number, e.g. “1,000,966”)
  • Y Coordinate  (Number, e.g. “244,894”)

The mysterious X, Y coordinate system within the data set was the most challenging transformation I decided to make. I could have geocoded the addresses – converting them into geographic coordinates (longitude/latitude), but that would have been a transformation that subtracted meaning from the coordinate system that the City uses to locate graffiti. Through a process of system research and trial-and-error, I discovered that the City was using the State Plane Coordinate System [1]. I used the Earth Point State Plane conversion tool to test this out and locations began to map in New York City under the following parameters: 3104 New York Long Island with measurements in US Survey Feet [2].

There are three reasons why I made this transformation from State Plane to the Geographic Coordinate System. First, it is relatively easier to map data points using the Geographic Coordinate System. Mapping software like Google Maps understands it and processes it much more readily. Second, there is a lot more data and examples of how to query the Geographic Coordinate System than the State Plane System. Third, any geospatial data I add in the future will be easier to compare and contrast when the base coordinate system is the same. That it is not the source data set’s coordinate system may be important, but I hope to acknowledge that by maintaining X, Y coordinates as an attribute of my data model.

Prelim Visualization of Data Set

Meaningful patterns emerged in the process of transforming the coordinate system. From the points I mapped, clusters and paths became evident. Those that were clustered together or were along a path often shared the same “Created Date” or “Closed Date”. Could this possibly be evidence of the path a SCOUT investigator or a clean up crew made as they moved through the city? It was pretty exciting to see!

Loading the data into a new database was the next challenge. This is where I started to think about database design along the lines of requirement analysis and logical and conceptual design as discussed in class.

The source data set that I am working with is not final. Every month the City inserts new records and updates previous records. Records from over a year ago are dropped from the data set. The text is alive. The database should be able to handle changes to the data set, retaining removed records and recording the changes that took place for values in updated records.

Documentation such as photos and notes on records need to be connected, but not be confused for the record. Maintaining a distinction between the record and research documentation will help in the design of queries to answer questions such as “What photos do we have of this graffiti before it was removed?”

Maintaining the separation of the record from research documentation brings attention to the conception of graffiti as a database-able entity. The conceptual design of my database excludes a specific entity “graffiti”. The graffiti itself, on the building wall is impossible to capture with certainty and so ought to be considered a non entity. The graffiti that the SCOUT logs may not be the same one that a cleanup crew removes. After all, about 8% of the closed cases ended with the cleanup crew not finding the graffiti.

Data Set Structure

The tables defined within the relational database into which the source data is imported.

The entities I am proposing in my conceptual design are location oriented. I chose to structure the data model upon location as the primary entity because it is here that places are defined and actions coordinated. It is defined by geographic coordinates, a street address, and the borough name. I was considering separating street addresses from geographic coordinates, but it appears that every street address is assigned only one geographic coordinate (something I failed to consider in my earlier decision to translate the X,Y coordinate system instead of geocoding the street address).

Multiple records can be associated with one location, so I am decomposing the city’s record into a location entity and a “graffito” entity. I’m using the word “graffito” because it is the plural of graffiti, but also because the archaeological use of the word captures a sense of legal authority in the marking. The graffito here is the City’s record of a graffiti mark and not the graffiti. The City is inscribing on the walls of geospace and hard drives a legal copy of the illegal trace. Would the graffiti be illegal if the city did not have a record of it?

Documentation of the graffiti then is guided by the official record, so photos and descriptions in analysis of the “graffito” will mean that these need to be stored in the database as separate entities related to the location by way of the official record under consideration. The documentation is concerned with changes over time in the record on the graffiti. The separate documentation entity is connected to the graffito through an intermediate entity I’m calling the “graff” – a play on the word’s etymology derived from both “stylus” and “grave”. This is where the urban researcher inserts documentation on the graffito, but also forms an essential part of exhuming the body of layered traces left by the combination of the City’s data set and the researcher’s records.

I am loading the data into a custom created database where I can analyze, visualize, and append data for an argument to be finally imported into the Urban Research Tool. That transformation will require its own ETL process.

References
[1] “State Plane Coordinate System.” Wikipedia, n.d. http://en.wikipedia.org/wiki/State_Plane_Coordinate_System.
[2] “State Plane Coordinate System”, n.d. http://www.earthpoint.us/StatePlane.aspx.

Posted in urban media forensic archaeology | Tagged | Comments Off on the simmering pot: from data source to data sauce

rummaging a data set: identifying the gaps

“Media archaeology rummages textual, visual, and auditory archives,” says Erik Huhtamo and Jussi Parikka, “as well as collections of artifacts, emphasizing both the discursive and the material manifestations of culture” [1]. The archive that I have been rummaging is a data set extracted from the New York City Open Data web site [2]. However, I must qualify this equation of the data set as an archive. The data set certainly resembles the OED’s definition of an archive, as a  “place in which public records are kept” [3]. More specifically, the place is the Internet, the record is each entry on graffiti, and the preserve of the record is secured by electronic storage and transmission.

The data set, however, is not quite an example of a textual, visual, or an auditory archive. As my review of the data set below will show, the attributes point primarily to times, places, and jurisdictions. It is an archive then of references to a particular kind of artifact and that is: walls modified by illegal inscription and restored by legal erasure. While it is in this way that the data set archives explicitly the material manifestation of culture, the absence of any reference to the variety of bodies that read and authored the walls un-archives the cultural discourse that took place. These bodies include, but are not limited to, the original author of the graffiti, the city’s street investigator that scheduled the graffiti for removal, and the removal crew that operated on the location. Each one of these bodies performed a reading and writing of urban space, constituting the space as a site of discourse. While I would like to consider this further in a later post, my aim here is to describe the data set, to identify the omissions it produces and explain why the data set needs to be transformed in order to perform a media archaeology on the city. That is, to borrow Huhtamo and Parikka’s framing of archaeology, to uncover the buried paths in the near past which might help us to find our way into the future.

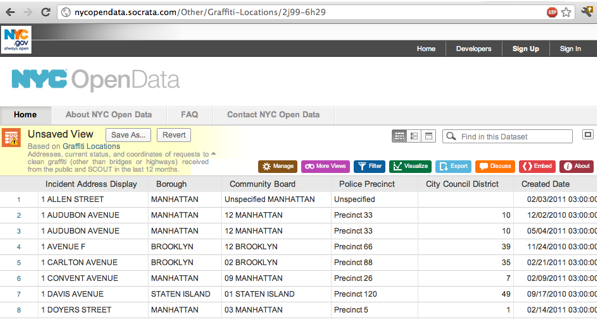
NYC OpenData - Graffiti Locations (Screenshot)

The following is an outline of the data set as found on NYC Open Data:

  • The data set is entitled “Graffiti Locations”
  • 14,000 records in the data set
  • Data set last downloaded on October 29, 2011
  • The first recorded entry is dated September 13, 2010
  • The last recorded entry is dated August 18, 2011
  • According to published meta data
    • The last update of the data set on NYC Open Data occurred October 24, 2011
    • The data set is updated monthly
    • The data is provided by the Department of Sanitation (DSNY)
  • Data set attributes and formats, presented here in the order that they appear online:
    • Incident Address Display (Text, e.g. “1 AUDUBON AVENUE”)
    • Borough (Text, e.g. “MANHATTAN”)
    • Community Board (Text, e.g. “12 MANHATTAN”)
    • Police Precinct (Text, e.g. “Precinct 33”)
    • City Council District (Number, e.g. “10”)
    • Created Date (Date Format, i.e. “MM/DD/YYYY HH:MM:SS AM -0500/-0400”)
    • Status (Text, i.e. “Open” or “Closed”)
    • Resolution Action (Text, “Cleaning crew dispatched. Property cleaned.”)
    • Closed Date (Date Format, i.e. “MM/DD/YYYY HH:MM:SS AM -0500/-0400”)
    • X Coordinate (Number, e.g. “1,000,966”)
    • Y Coordinate  (Number, e.g. “244,894”)

The meta data for the data set is accessible under a maroon “About” button. The data set is described as “Addresses, current status, and coordinates of requests to clean graffiti (other than bridges or highways) received from the public and SCOUT in the last 12 months.” SCOUT is New York City’s “Street Conditions Observation Unit”. It is part of the Mayor’s Community Affairs Unit [4]. SCOUT supports the City’s 311 system by inspecting the condition of every city street about once a month. From the metadata we gather that the two government bodies responsible for graffiti removal is the Community Affairs Unit in the Mayor’s Office and the Department of Sanitation.

Certain key subtractions are performed as the data set is updated over time. First, since the data set only presents the last 12 months of records, it truncates records regardless of whether the graffiti was successfully removed or not. Second, the data set only presents the most recent record on a graffiti location. This means that any prior activity related to a particular graffiti location is removed and replaced with only the most recent event. Third, each record is intended to identify one graffiti mark per location. A location with multiple graffiti tags may have multiple entries. As a consequence, it is not possible to distinguish one graffiti marking from another at a location. Fourth, while police and governing jurisdictions are identified for each location, the reporting bodies (SCOUT, general public) and removal teams are omitted along with their particular mechanism of reading or re-writing the space.

These appear to be reasonable omissions in light of the purpose of the data set. The only records worth storing and transmitting are those that aid in coordinating the graffiti removal process – a process that is meant to affect measurable improvement in the quality of life in the city. As Mayor Michael Bloomberg put it: “Not only is [this] technology helping us to speed up the delivery of services, it’s also helping to make City government more accountable” [5]. But then, why identify the council district or police precinct in the data set? Neither are among the three government agencies  directly responsible for the process of graffiti removal. Also, why truncate the data to include only the past 12 months? Data generated since the opening of the project is needed to help determine if the process affected faster and more accountable deployment of city resources.

To redress these perceived omissions, I am importing the data in a new, self-hosted database. This allows me to create a data model that will maintain a history for each graffiti location that is not truncated over time.  It also allows permits me to add documentation to the city defined data set – documentation such as photos and field notes from the location. Furthermore, by transforming the data set an analysis and visualization can be performed free from the constraints of the City’s data model – a decidedly desk bound data model that erases the situated context within which the data was performed and traced. It is no good to rummage a data set of references without rummaging among those spaces, i.e. reading the walls. My aim in transforming the data is to restore the various reading and writing paths for which this data set represents a malformed trace.

References
[1] Huhtamo, Erkki, and Jussi Parikka. Media Archaeology: Approaches, Applications, and Implications. University of California Press, 2011, p. 3.
[2] “Graffiti Locations.” NYC Platform, n.d. http://nycplatform.socrata.com/dataset/Graffiti-Locations/mcd4-i5wd.
[3] “archive, n.”. OED Online. September 2011. Oxford University Press. http://www.oed.com/view/Entry/10416?rskey=UQ5Llx&result=1&isAdvanced=false (accessed November 21, 2011).
[4] “NYC*scout.” Mayor’s Office of Operations, n.d. http://www.nyc.gov/html/ops/html/data/street.shtml.
[5] AT&T Wireless Solution Provides Fast Lane for Citizen Complaints. Case Study, 2009. http://www.wireless.att.com/businesscenter/en_US/pdf/NYCSCOUT-CaseStudy.pdf.

Posted in urban media forensic archaeology | Tagged , | Comments Off on rummaging a data set: identifying the gaps

striking lines to punching buttons: surrealist erasures and the mechanical writing method

Crosses and Commands - Surrealist Manifesto

– from Andre Breton’s The Automatic Message

To understand surrealist automatic writing, we might think of typing without backspace or undo. In the process of writing this first sentence, I performed countless of edits. The words are coming with difficulty. Something is here, but it needs to be conformed to a coherent structure. What compels me to write here at all, is a pressing difference. It has to do with the difference between Breton’s crossing-outs and today’s Command-Z. It has to do with the difference in the mechanisms of inscription and the shifting material of the page.

Breton’s crossings-out are vile, because he is sitting with a pen and paper at a table. Taking care to economically find the way between ink pot and paper, Breton brings thought to page. With the strike of a line, the trace of the mechanism’s messiness is revealed, but also of the breaks that occur in the process of writing. The correction of a screen text is different. The strikeout is now a deprecated function. Undo performs too well – restoring to screen an absence without apparent lines or gaps.

The “page” on screen is not afflicted by any changes. It handles all edits with valorous dexterity. No crumpled pages lie next to this desk. This, however, is a false difference. Electronically set words are not on a page, but are rather always set in fields. These fields, like the hollow of a grave in a cemetery, mean that words are realized in a labeled space on a coordinated grid. The “ancient house of correction” which Breton says makes impossible the escape from the structures of language and the present symbolic order, move with the digital text to the background, that is, into the page itself. The text on screen is a conceptual object -figured and configurable as if suspended in the mind. Even so called “page revisions” capture the text in its becoming. Page revisions record the ordering of texts and the subsequent edits. These revisions can be reviewed bringing a sense of the mind’s process and so now, perhaps quite unintentionally, all screen texts become an automatic message.

Where intentional automatic messages remove the rusting barriers to life, unintentional automatic messages remove the rusting barriers to death. The electronic text stays conceptual and here is the emerging problem: the electronic text is enfolded in the material in an order. It is this ordering that makes the automatic message either essential or impossible for electronic texts. Essential, because all electronic texts as entered in fields ensure continuity as a conceptual entity. Or impossible, because electronic texts are materially informed with a governing, calculating structure.

For the surrealist (or at least Breton) the strike is an unsatisfying erasure. With that strike goes the flame of inspiration – an anti-mediation of spirit, perhaps. So the inverse is the case today, positioned within the near-past electronic media milieu: the backspace button guards with a fluorescent glow the place of inspiration.

Posted in question of materiality | Tagged , | Comments Off on striking lines to punching buttons: surrealist erasures and the mechanical writing method

graff/it/i new york city web app

graff/it/i new york city

I believe that a key part of making a spatial argument is to situate it in the very geospatial context of the reader. I want to explore the possibility of doing this by inviting smart phone users to participate in this design research web app project.

“graff/it/i new york city” maps the graffiti that the city either scheduled to remove or recently have removed. The locations presented through the app combines and aggregates the graffiti locations data set from NYC OpenData with data collected by users of the app on the locations. The data that users submit may included photos, tags, and descriptions of the record’s location. Currently only photos of the graffiti locations may be posted.

Users can explore the data that the city generates by navigating between graffiti pending removal and graffiti that was removed. Details of the record can be retrieved. In addition, the user can explore possible paths that cleaning crews and street investigators navigated by tracking the record’s “spoor” – i.e. stringing together nearby records that were made on the same date.

This is a web app, so some functions are a little odd. To add photos, please download picup from the iTunes store in your iPhone (this may not be the same app for Android devices). Once you have opened the web app in Safari, you can save it to your home screen by clicking the “Add to Home Screen” menu under the “forward” button next to the bookmark button in the browser. To open the app point a qr-code reader on your smart phone to:

Posted in urban media forensic archaeology | Comments Off on graff/it/i new york city web app